Water distribution networks / Data & IoT
Understanding a water network, one connection at a time.
A Python project that models water-distribution networks and compares their structure before and after proposed expansion.
- My role
- Python / graph algorithms
- When
- 2025
- Built with
- Python · Matplotlib · Dijkstra · Maximum flow · Graph algorithms
Explore how it works
Try it yourself ↓One new pipe can change the whole network.
Adjust an inlet, add a direct connection, and compare capacity with the shortest route.
Each label shows flow / capacity in L/s. Pipes are directed from left to right.
Inspect all pipe values
| Pipe | Flow (L/s) | Capacity (L/s) | Distance (km) |
|---|---|---|---|
| S → A | 6 | 6 | 3 |
| S → B | 3 | 4 | 2 |
| A → C | 4 | 4 | 2 |
| A → D | 2 | 2 | 4 |
| B → C | 1 | 2 | 2 |
| B → D | 2 | 3 | 3 |
| C → T | 5 | 5 | 3 |
| D → T | 4 | 4 | 2 |
The direct pipe adds 3 L/s of capacity across a 2 km connection.
Increasing one inlet alone cannot push more than 9 L/s through the two outlet branches.
A fictional directed network runs Dijkstra and Edmonds–Karp in your browser. Capacities and distances are illustrative; this does not simulate hydraulic pressure or a real water system.
The challenge
A water network is a system of connected sources, pipes, and destinations. This academic project explores how that structure affects sectoring, capacity, sampling routes, and the consequences of adding new connections.
How I built it
Turn the network into a graph
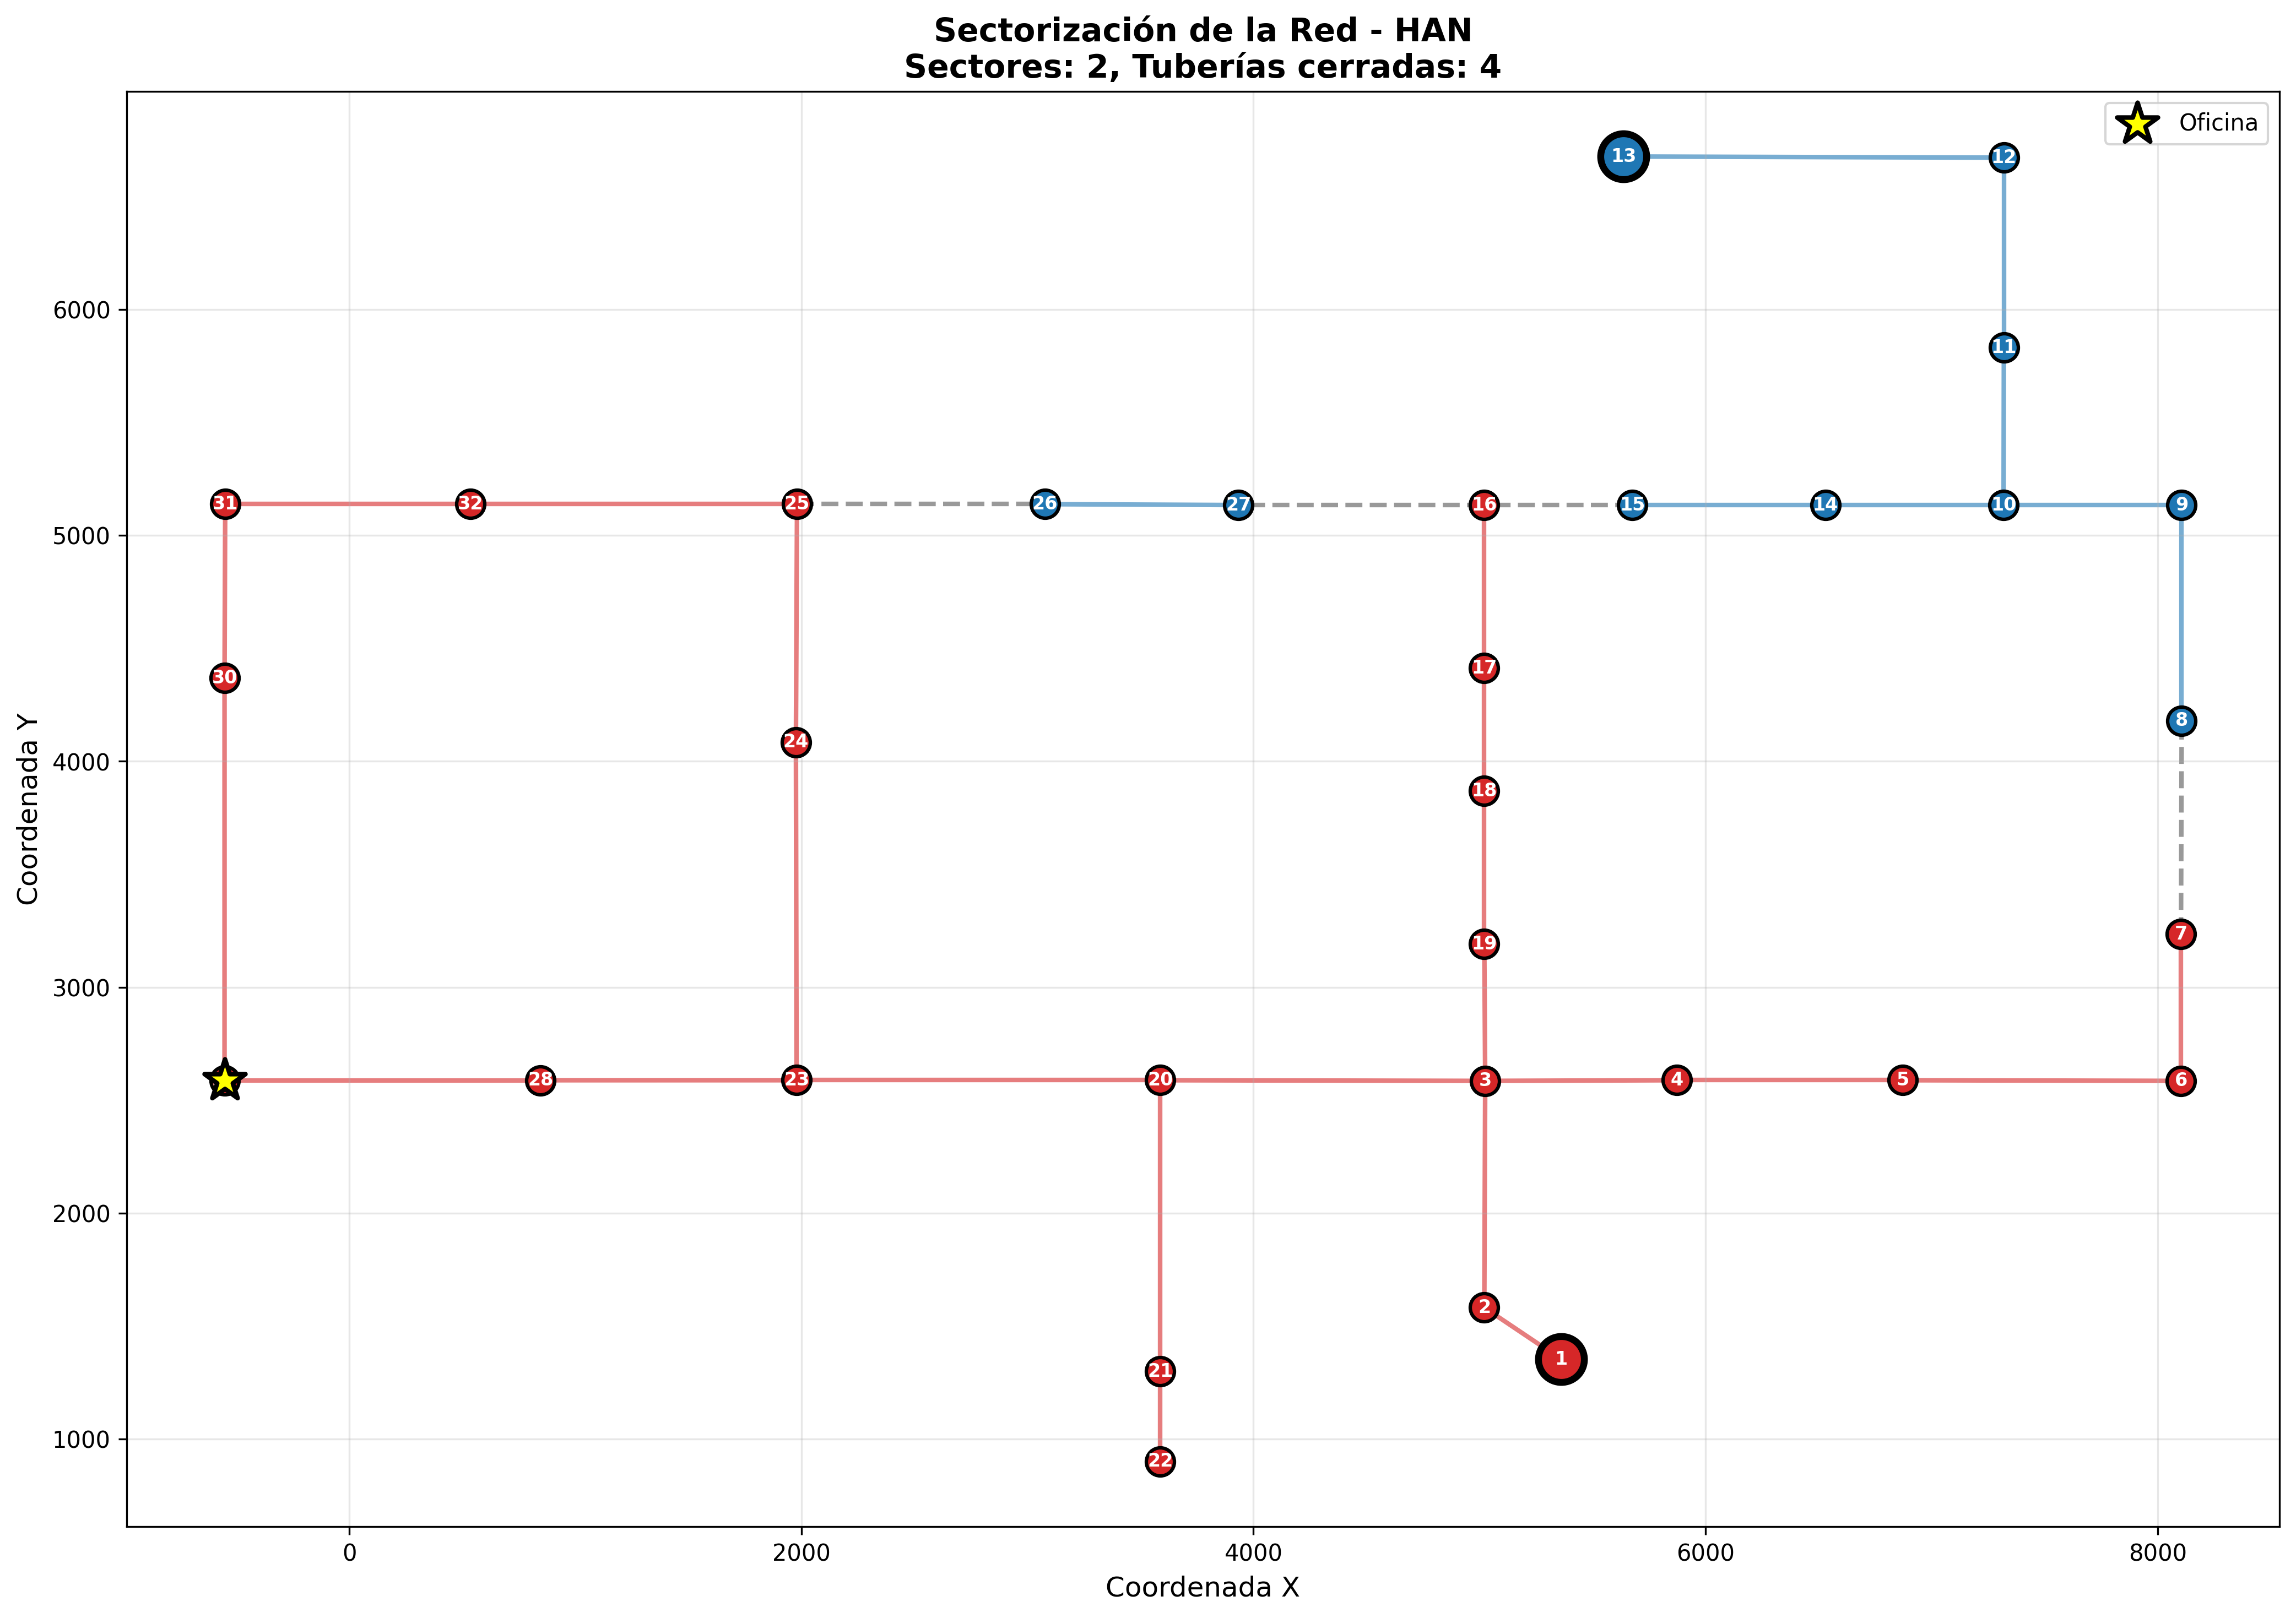
I parsed four network instances into nodes, pipes, sources, and proposed connections, then partitioned networks by source and analyzed shortest paths and maximum flow.
Plan a sampling route
Dijkstra distances provided the basis for water-sampling tours. Nearest-neighbor ordering produced an initial route, followed by 2-opt improvements.
Make the comparison visible
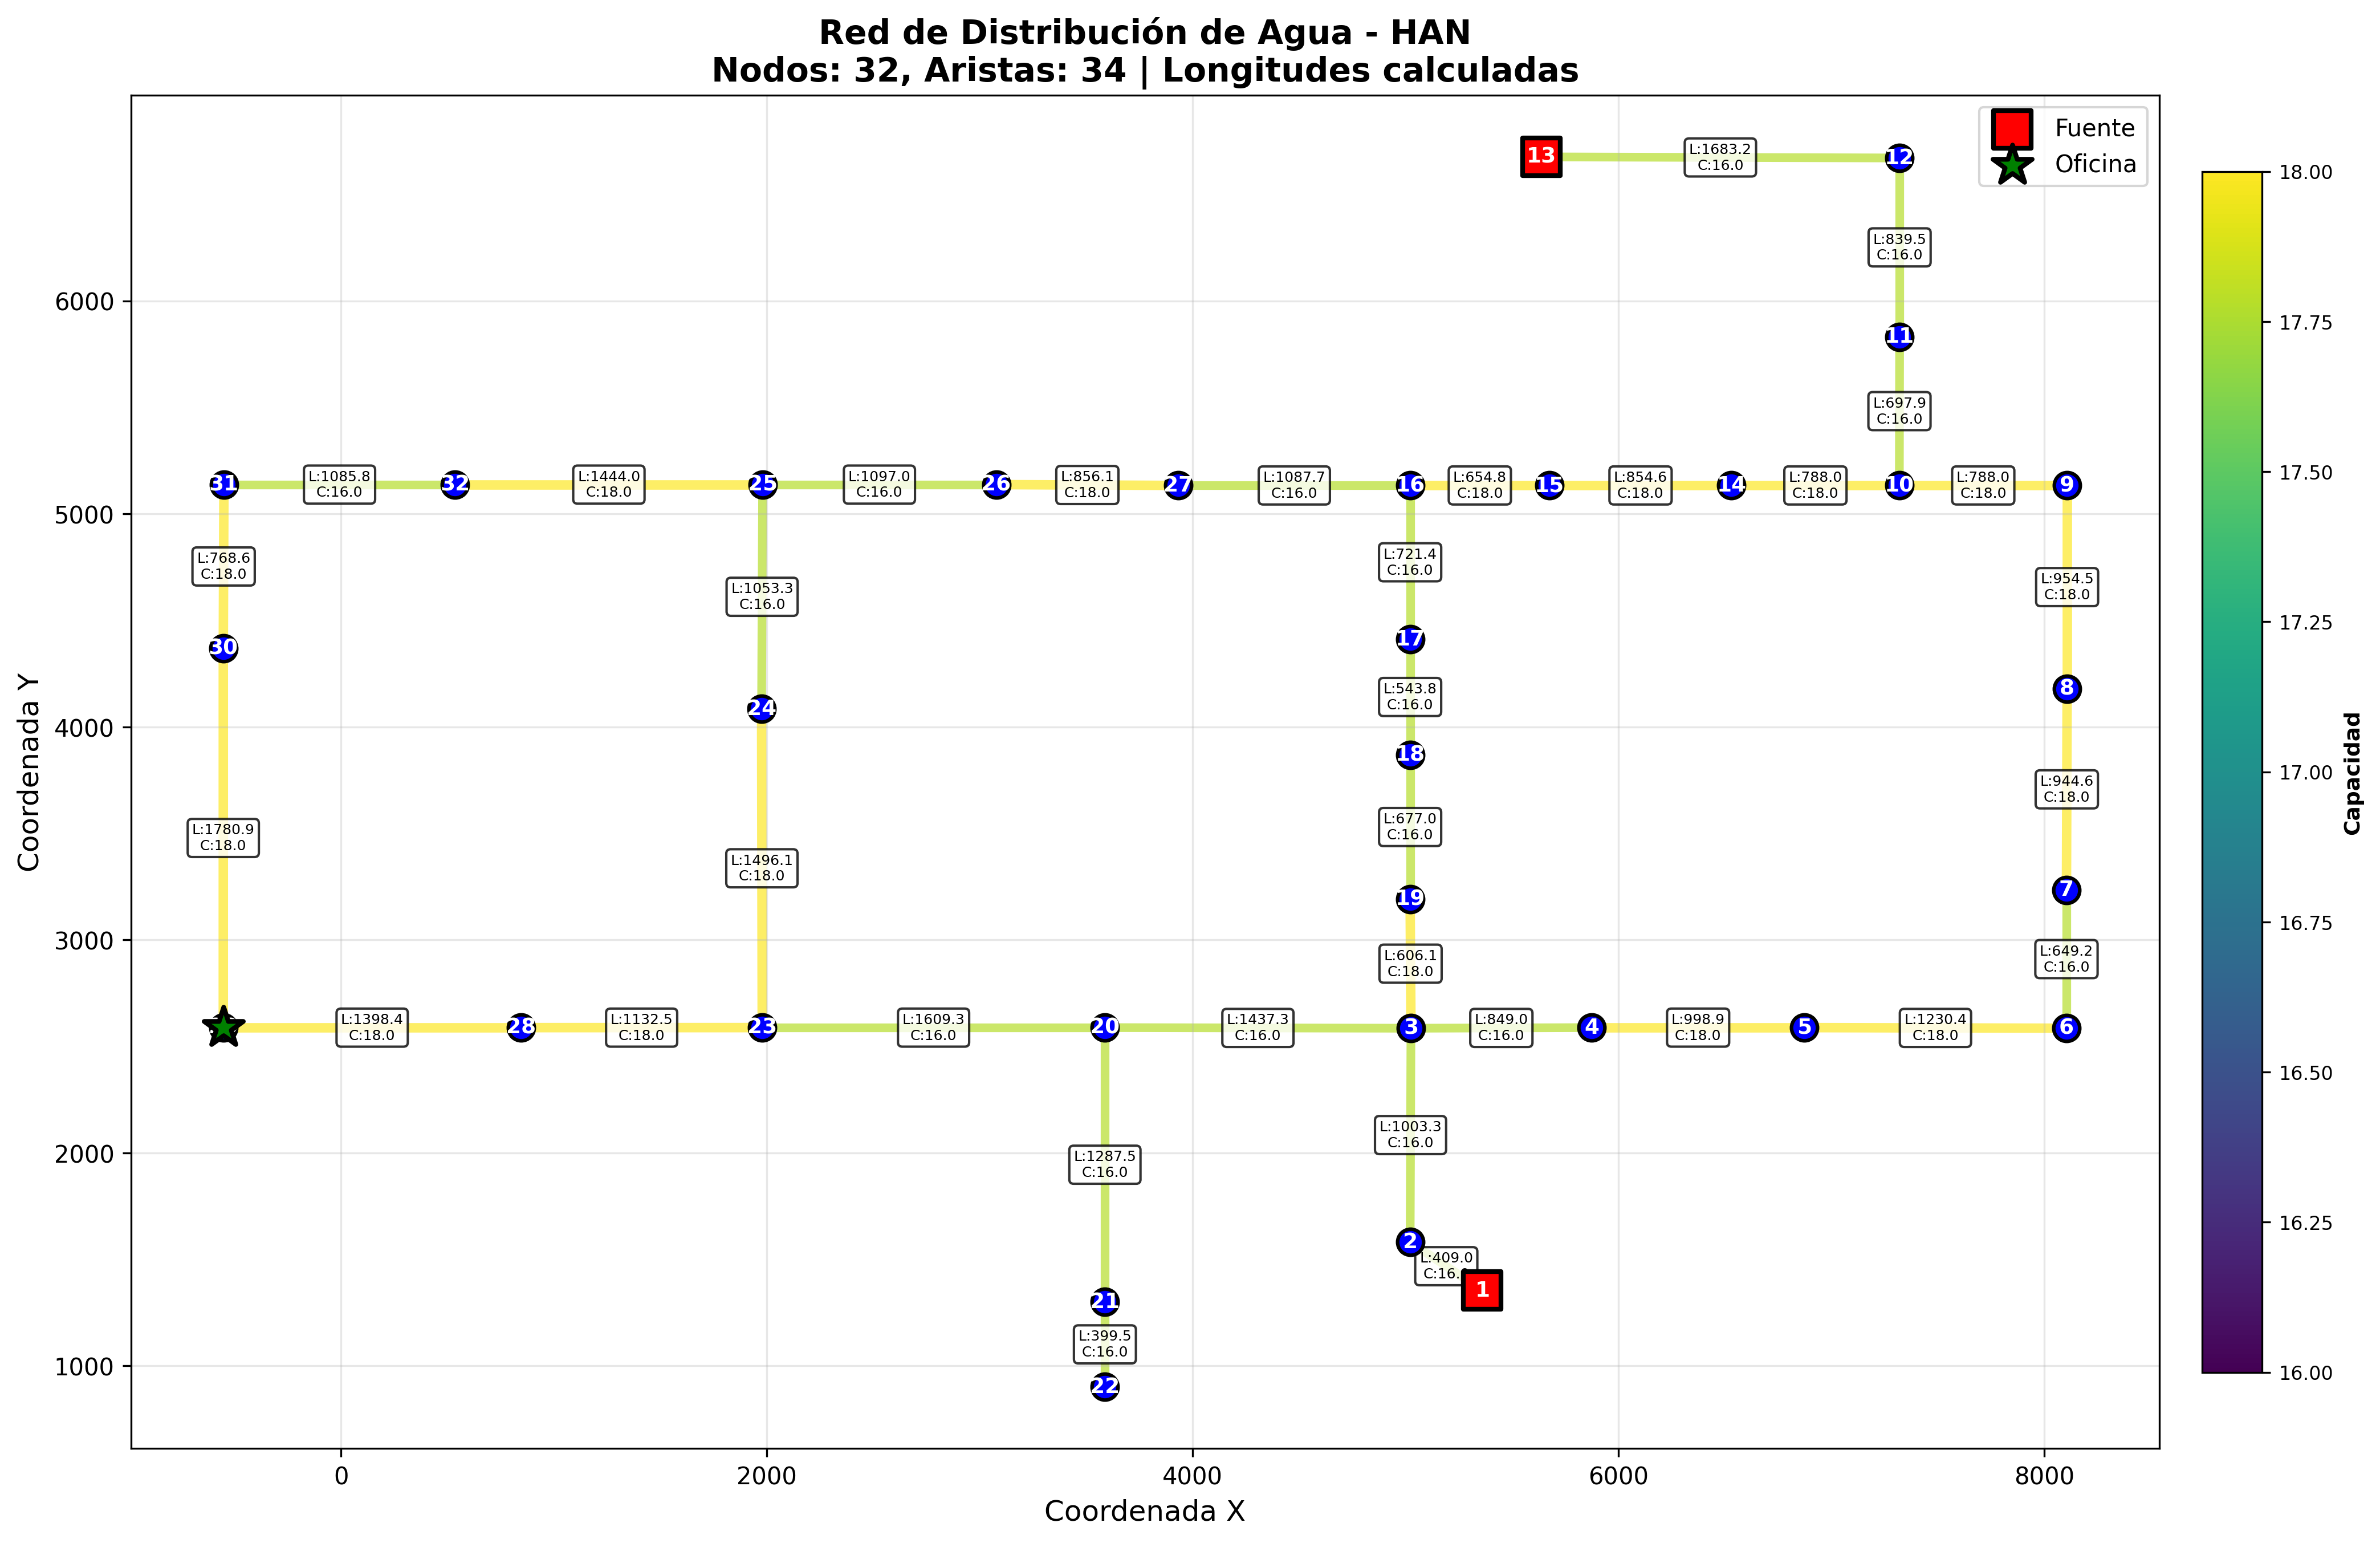
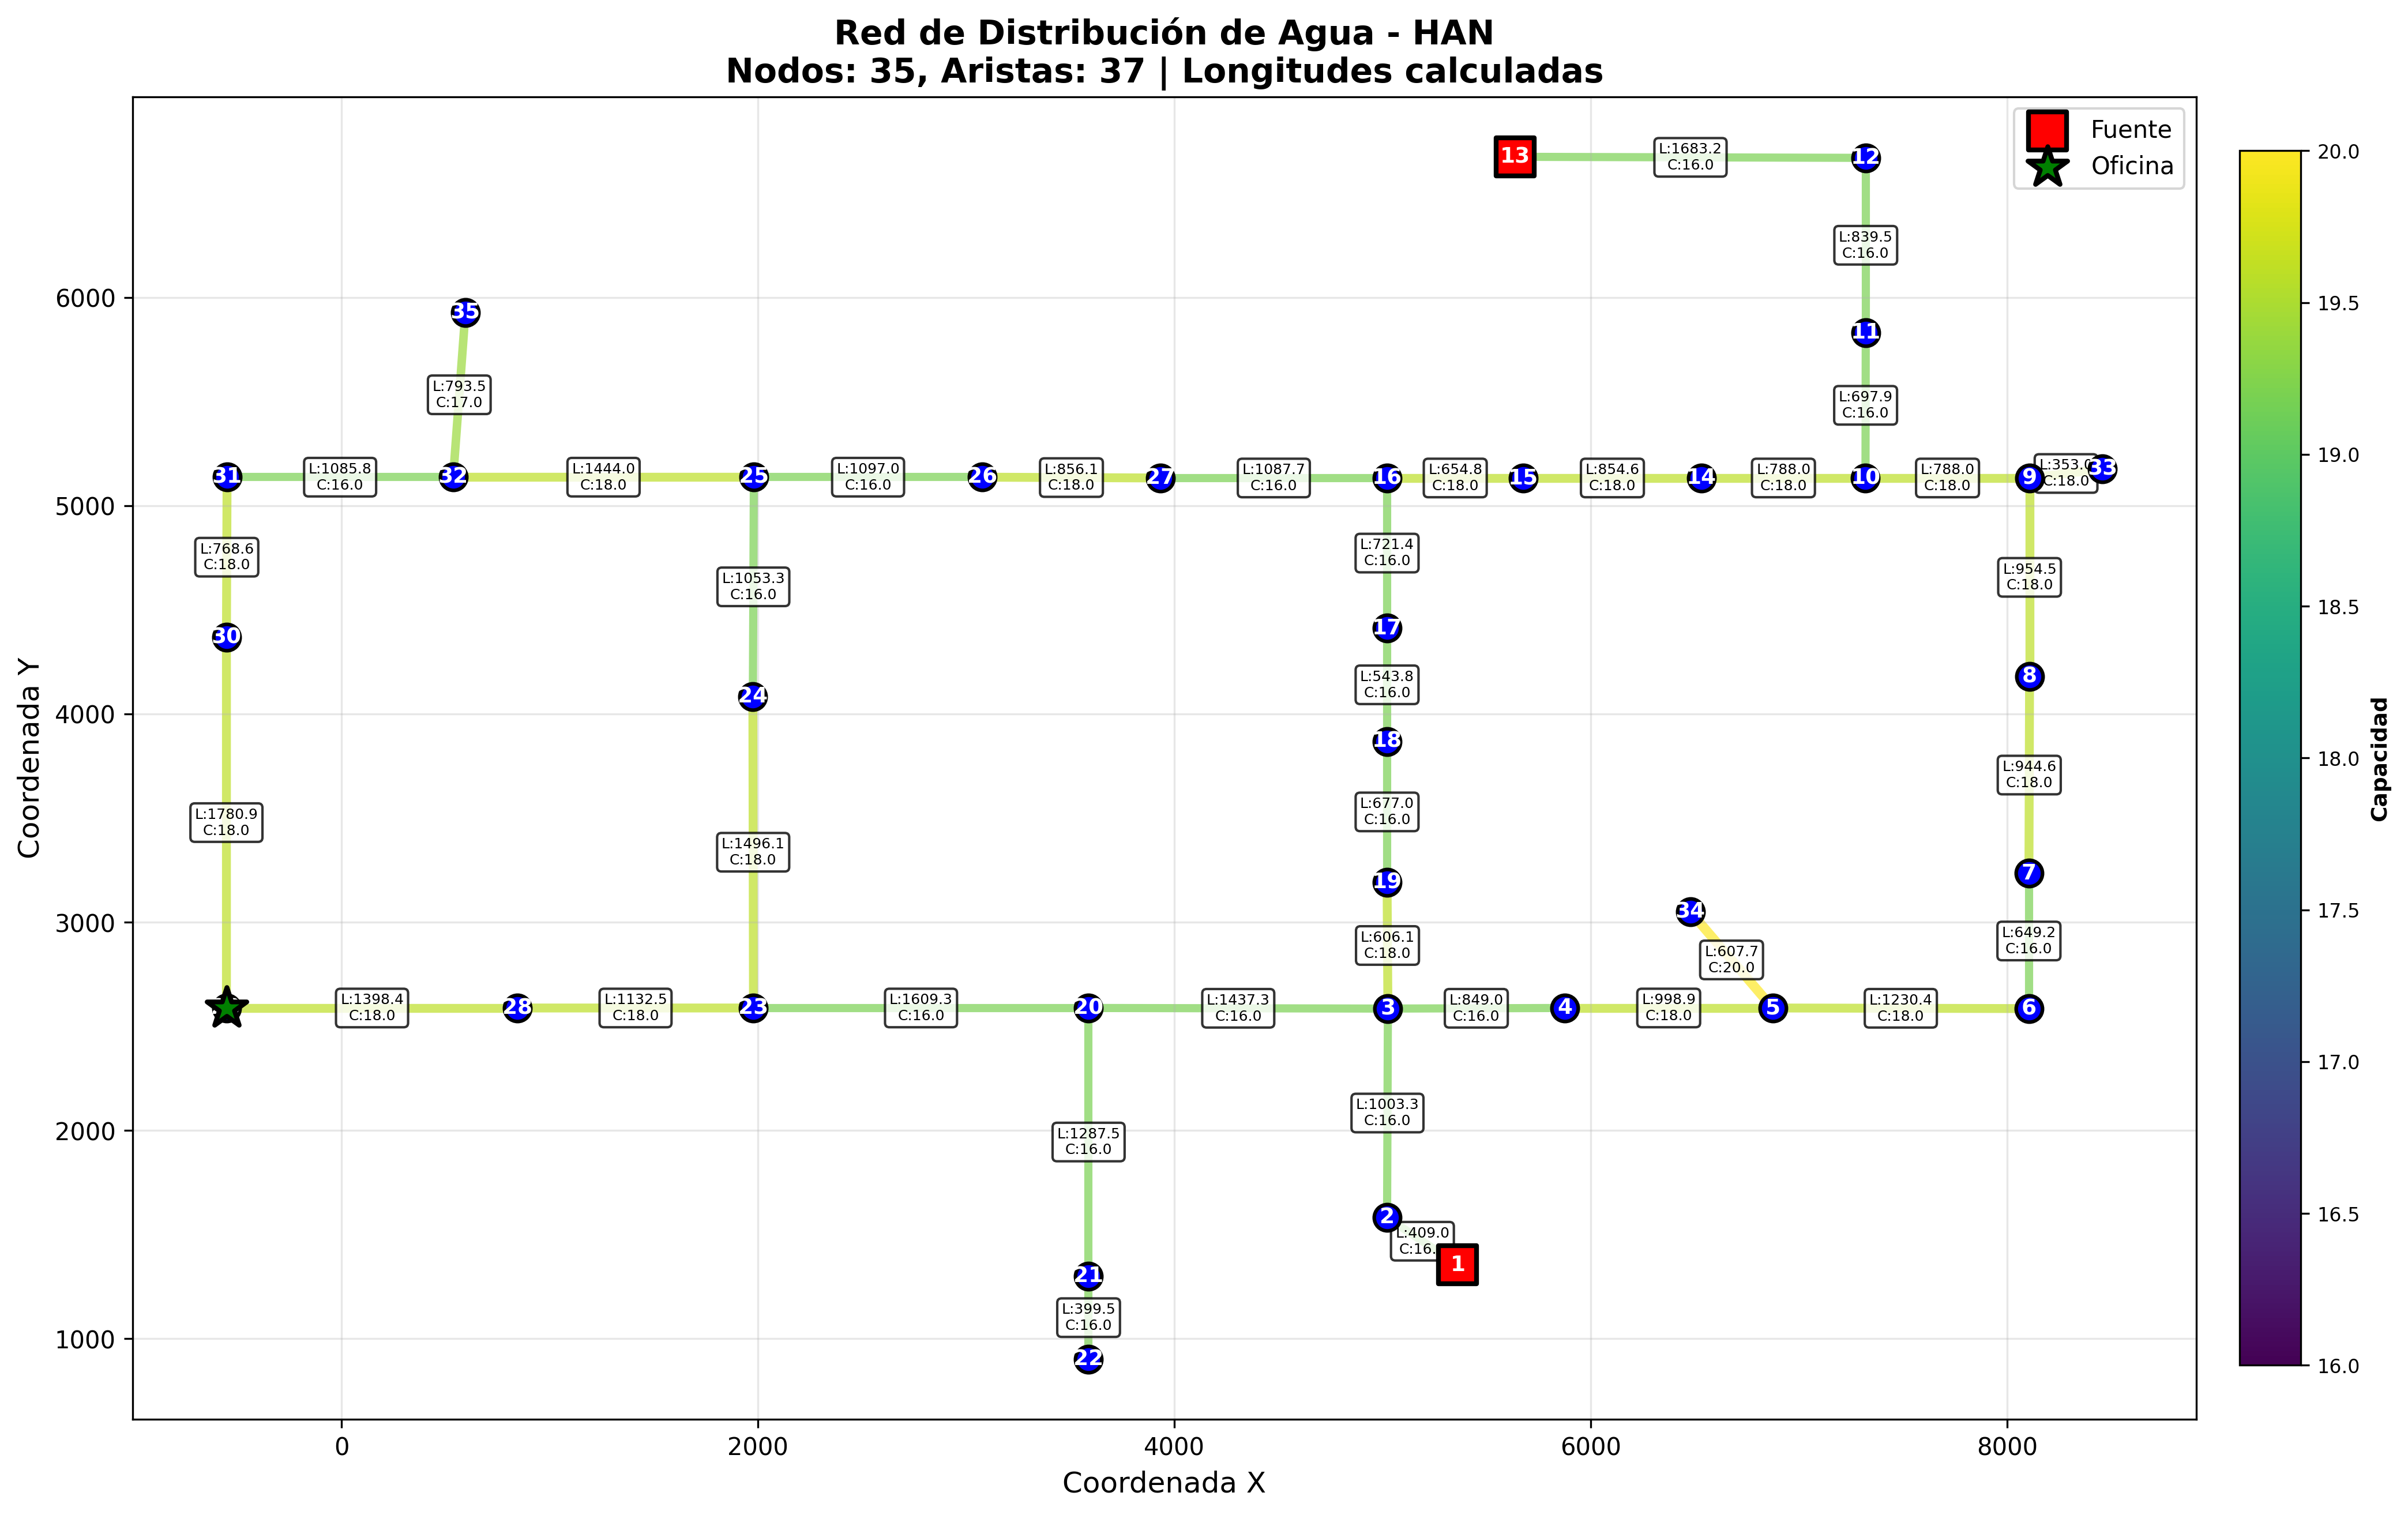
Generated reports and Matplotlib plots show the network before and after expansion, alongside sector boundaries and connection capacities.
What came out of it
An academic network-analysis program with source code, reports, and actual generated visualizations. The project demonstrates graph-based planning on simulated network instances.
Original plots from the project repository: the HAN network before expansion, after expansion, and divided into sectors.
Sources & project context
More from the project