CNN robustness & calibration / AI & apps
Independent controlled experiment
CNN confidence under corruption.
Six ResNet-18 runs test how image corruption changes accuracy and confidence. Mixup improved the measured averages, while calibration fitted on clean images helped the baseline and hurt mixup under corruption.
- My role
- Experiment design / training / evaluation
- When
- October 2026
- Built with
- Python · PyTorch · ResNet-18 · NumPy · CIFAR-10-C · Matplotlib
Outcome
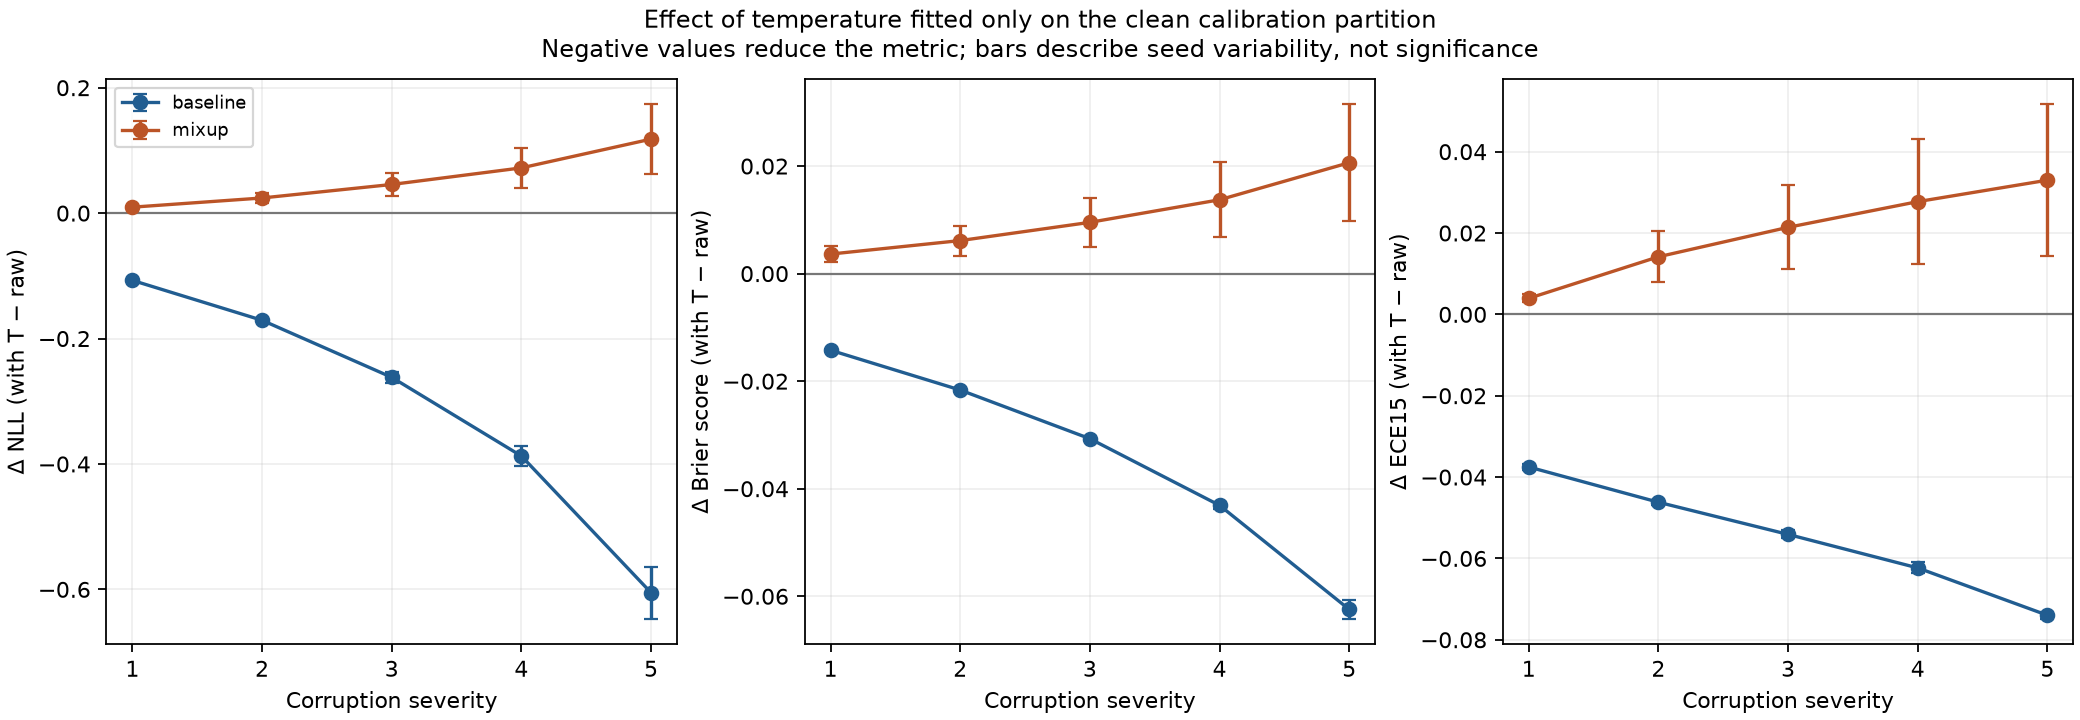
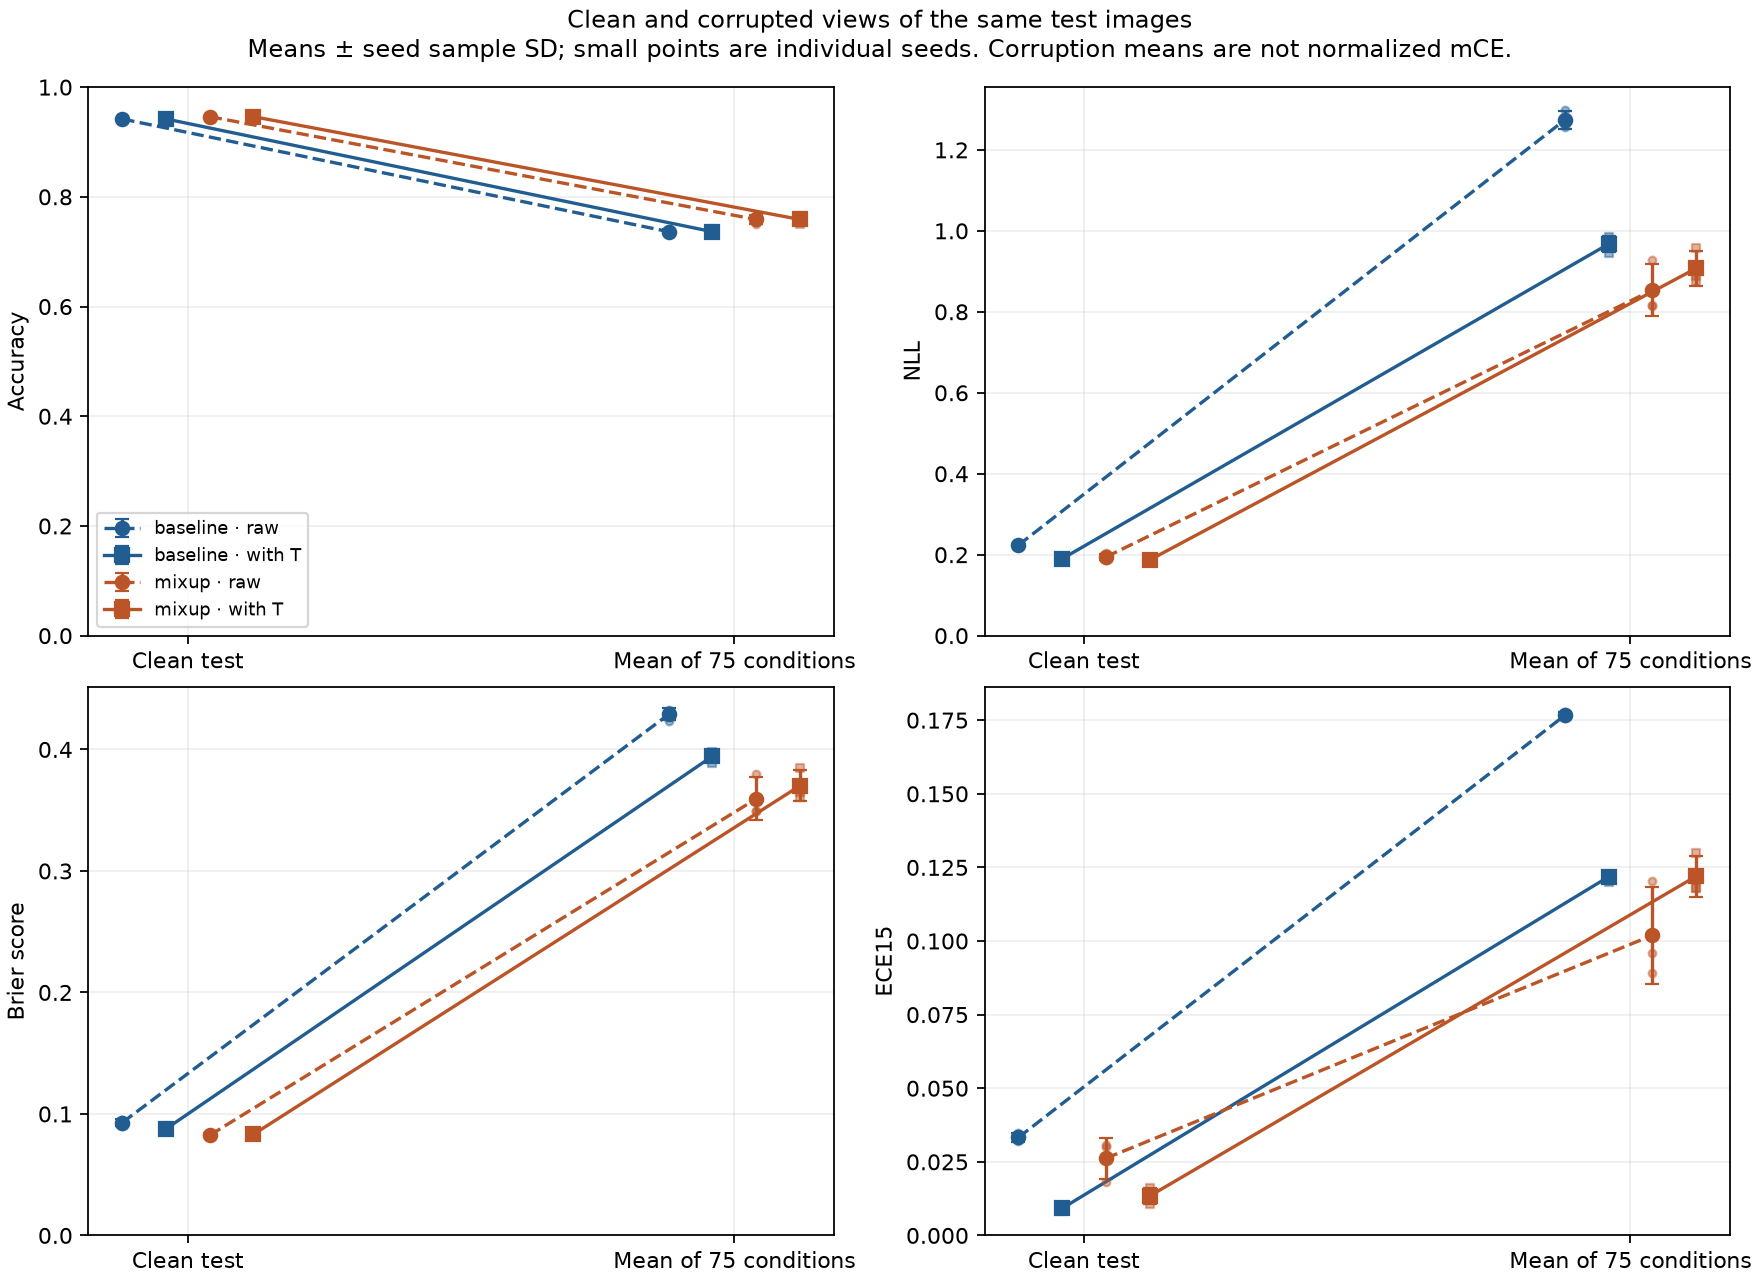
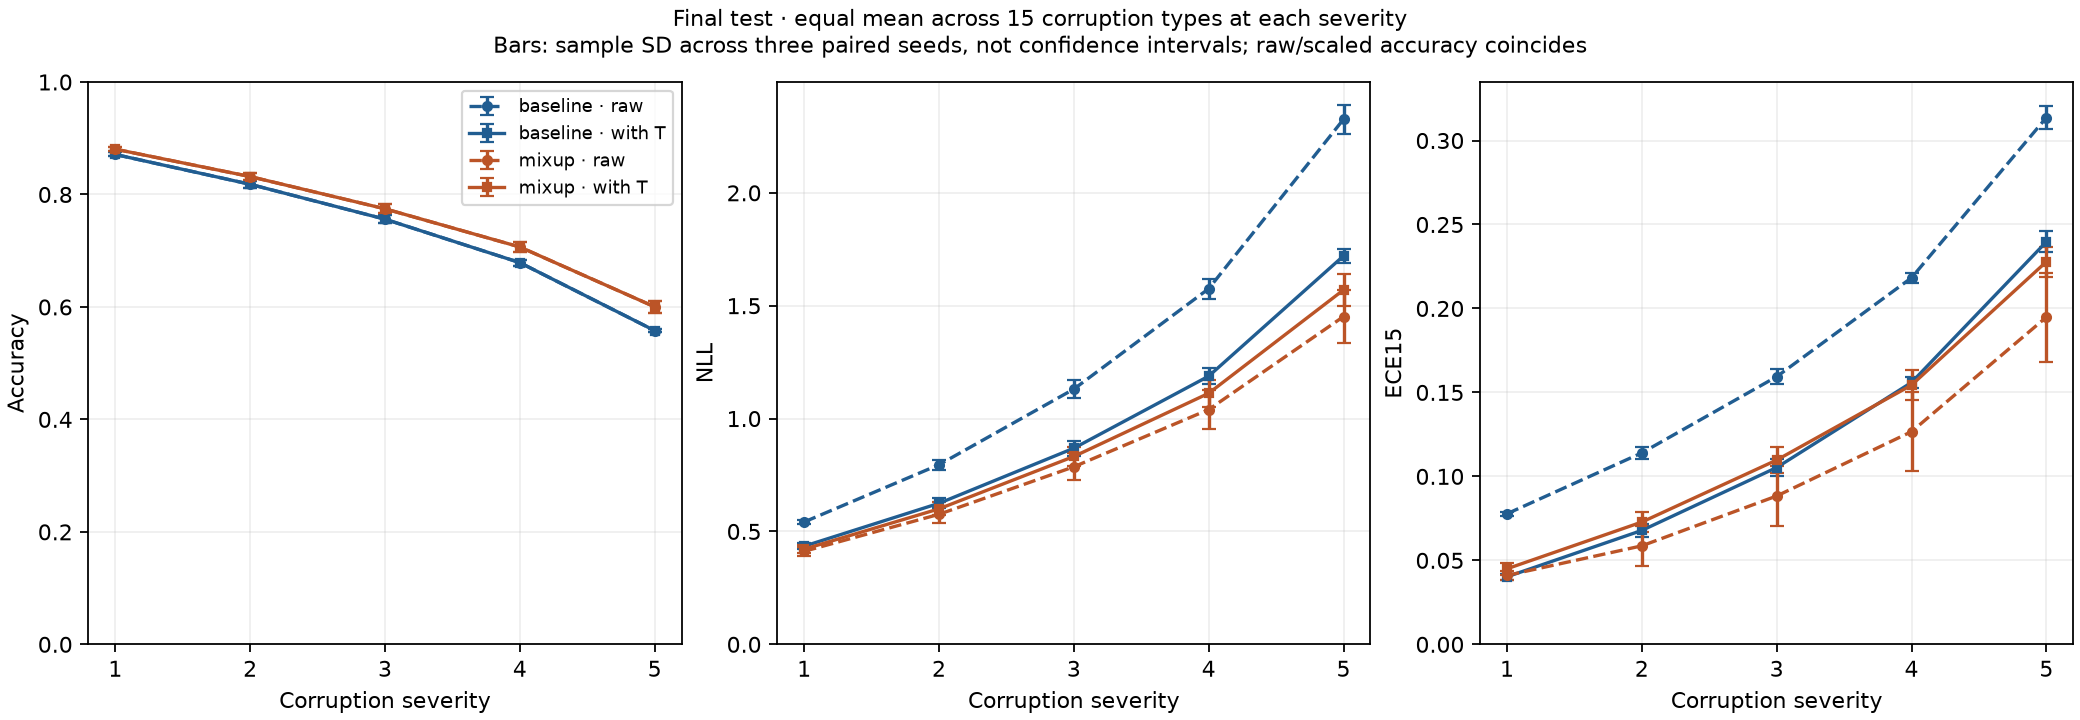
Mixup raised mean clean accuracy from 94.19% to 94.62% and mean corruption accuracy from 73.64% to 75.88%. Unscaled corruption NLL fell from 1.274 to 0.853. Clean-fitted temperature scaling then reduced baseline corruption NLL to 0.967 but increased mixup's to 0.907: a benefit on clean images did not transfer uniformly to corrupted inputs.
The interactive explorer and figures use measured final-test results. Means and sample standard deviations describe three paired training seeds; they are not confidence intervals. Corrupted variants share the same source images, and this study does not establish general real-world or adversarial robustness.
The challenge
A classifier can become confidently wrong when its inputs change. I wanted to measure whether mixup improves a CNN's predictions under common image corruptions, and whether a temperature fitted on clean held-out data keeps helping when those images shift.
Approach
Keep each data role separate
I froze the comparison before full training and used 40,000 CIFAR-10 images for training, 5,000 for checkpoint selection, and 5,000 for calibration. The official 10,000-image test set and its corrupted versions were reserved for final evaluation.
Compare six controlled training runs
I trained baseline and mixup ResNet-18 models from random initialization for 100 epochs each, pairing seeds 42, 43, and 44. Architecture, optimizer, augmentation, partitions, and checkpoint selection were held fixed; mixup used alpha 0.2.
Test confidence under the same shifts
Each selected checkpoint was evaluated on clean test images and all 15 standard CIFAR-10-C corruption types at five severities. I measured accuracy, negative log-likelihood, Brier score, and 15-bin calibration error before and after a temperature fitted only on the clean calibration split.
Retain the evidence behind the averages
Saved predictions, checkpoint identities, source snapshots, and condition-level metrics support the analysis. Corruption metrics are averaged within each run, then compared within each paired seed. The figures show seed variability and preserve the negative finding about calibration transfer.
Explore how it works
Try it yourself ↓Confidence under corruption.
Follow the same image through the test. See what each model predicts, then compare results across three training seeds.
Scaling changes confidence, not the predicted class. Temperatures were fitted on separate clean calibration data.
One image, observed closely
Saved predictions · seed 42 only


Confidence · T = 1.00
Confidence · T = 1.00
Fixed test IDs 0, 1 and 4 are illustrative examples, not a representative sample. Confidence is the probability assigned to the predicted class.
The full test, across three seeds
Gaussian noise · severity 3 · 10,000 images per seed
| Metric | Baseline | Mixup |
|---|---|---|
| Accuracy ↑ | 42.34%± 4.20% | 43.98%± 4.68% |
| NLL ↓ | 3.205± 0.253 | 2.109± 0.347 |
| ECE ↓ | 43.83%± 3.23% | 33.01%± 6.48% |
Mean ± sample SD across seeds. SD is not a confidence interval. NLL measures log loss; ECE measures calibration error using 15 bins.
Track the change
Gaussian noise · severity 3. cat example, original ID 0. Before temperature scaling.
More from the project