EDUARDO CEPEDA · INDEPENDENT CONTROLLED EXPERIMENT · 2026
CNN confidence under corruption.
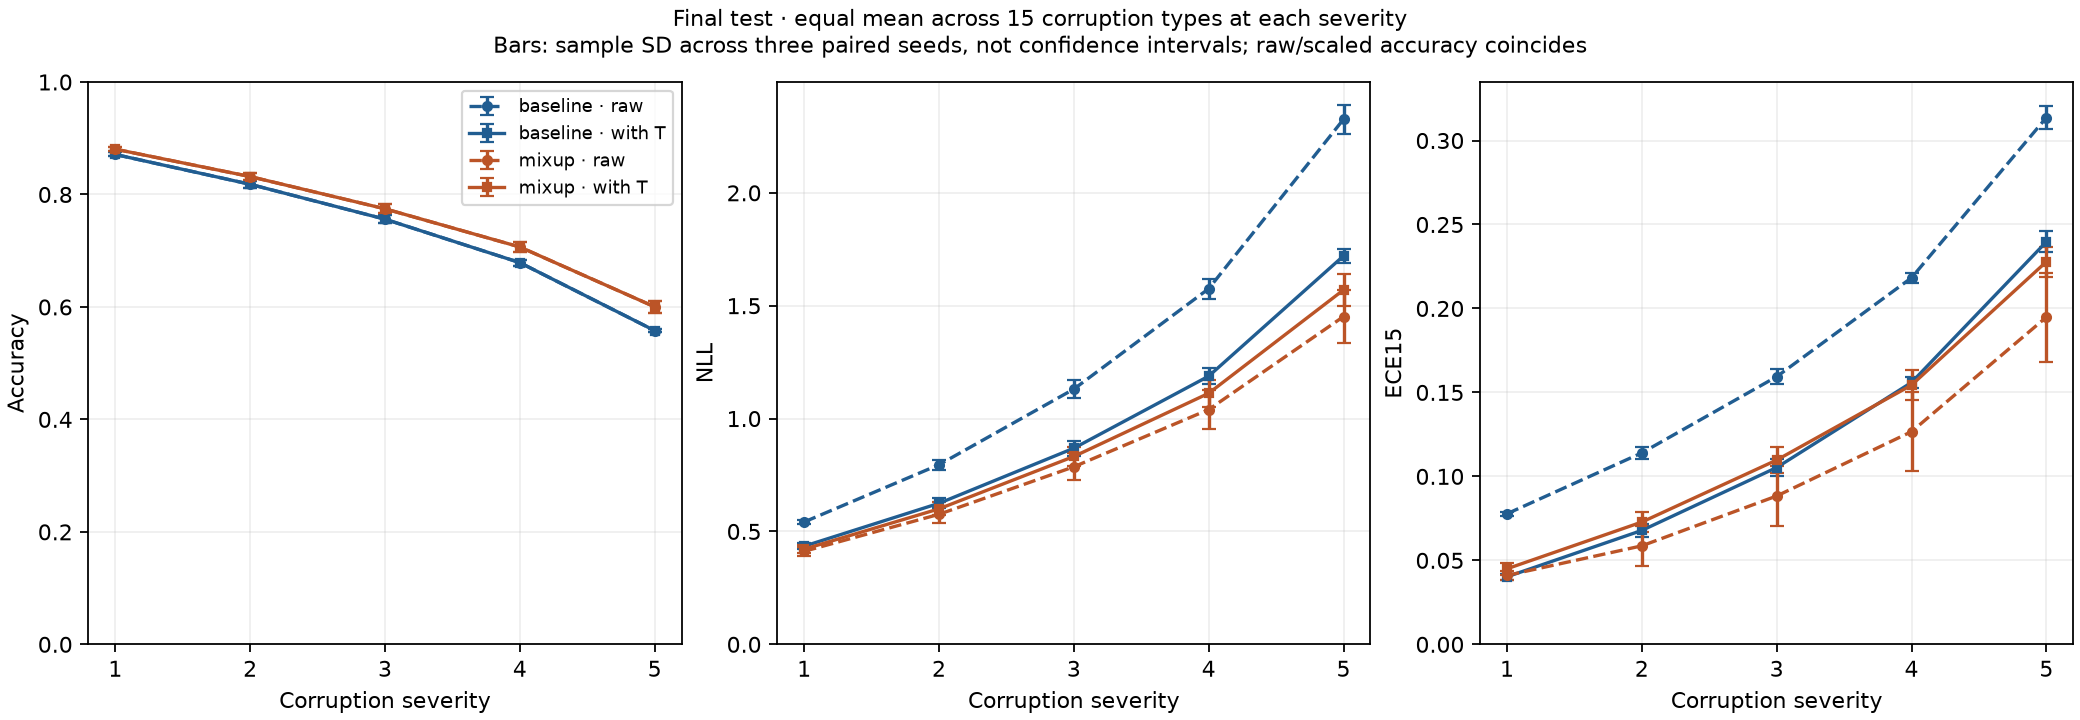
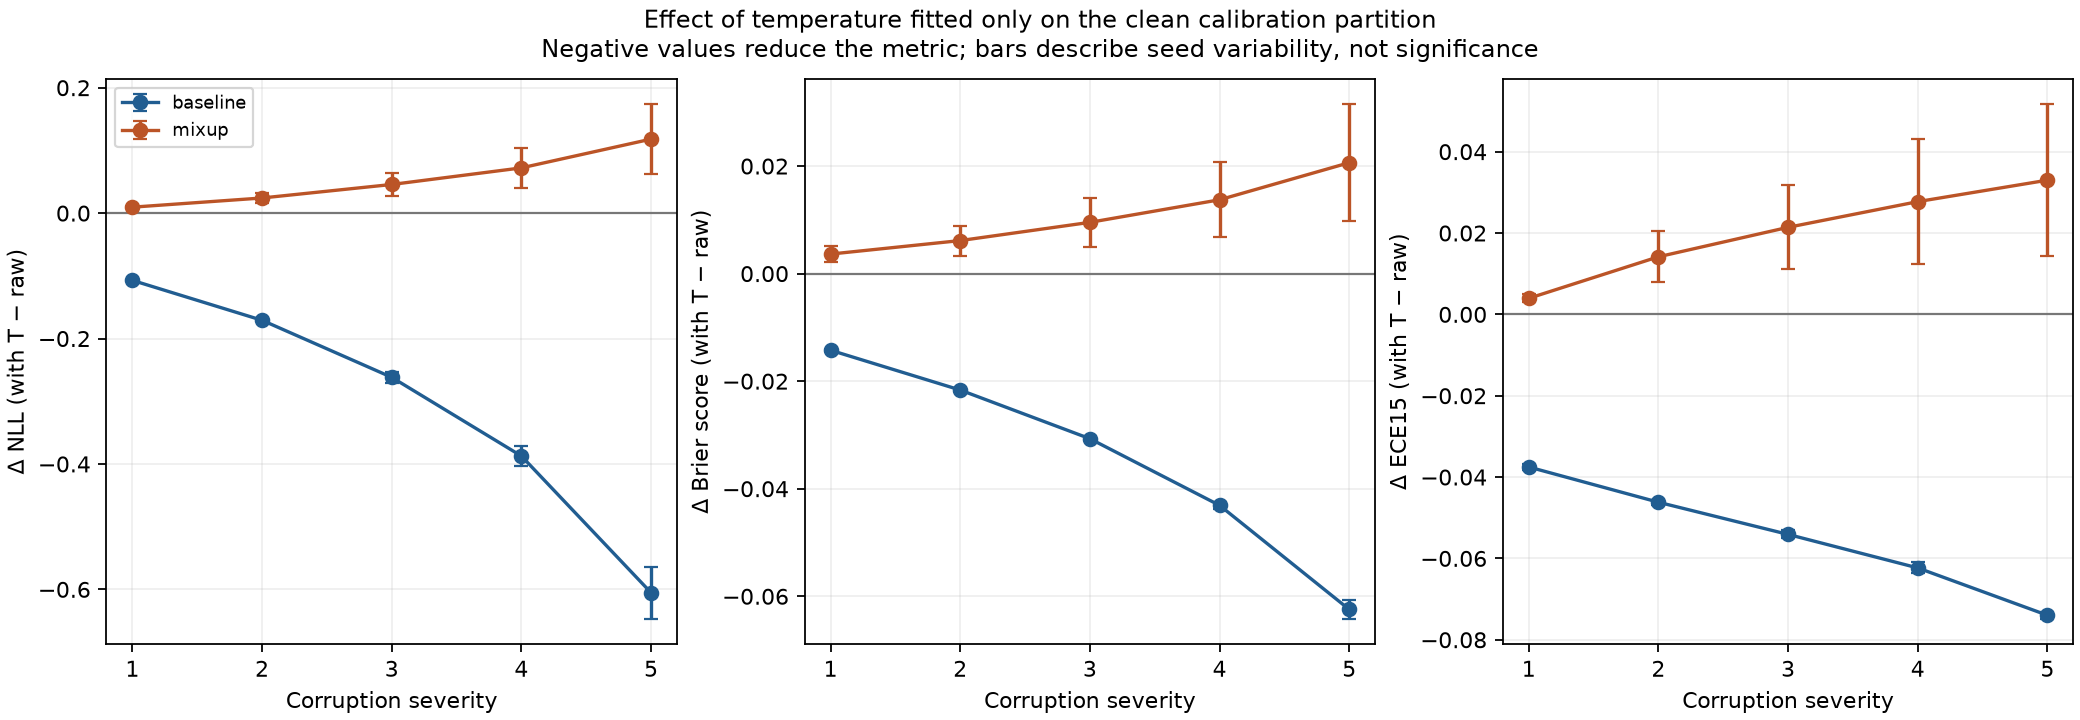
Mixup improved the measured accuracy and mean corruption NLL. Temperature scaling fitted on clean images helped the baseline under corruption, but worsened mixup's corruption NLL, Brier score, and calibration error.
Completed study: full-2026-10-08. All results below come from six completed training runs and final saved predictions.
What was compared
Six CIFAR-adapted ResNet-18 models trained from random initialization for 100 epochs each: baseline cross-entropy and mixup with alpha 0.2, paired across seeds 42, 43, and 44. Architecture, optimization, augmentation, and data partitions were held fixed. Checkpoints were selected by minimum validation NLL.
A fixed stratified split reserved 40,000 CIFAR-10 images for training, 5,000 for validation, and 5,000 for fitting temperature. Each checkpoint was evaluated on all 10,000 official test images and the 15 standard CIFAR-10-C corruption types at five severities. No temperature was fitted on test or corrupted data.
The primary paired comparison
Mixup minus baseline, after averaging the 75 corruption conditions within each run. Negative NLL differences favor mixup; positive accuracy differences favor mixup. Values are means ± sample standard deviations across three paired seed differences.
| Scaling | Δ NLL | Δ accuracy (percentage points) |
|---|---|---|
| Raw | -0.4207 ± 0.0425 | 2.2348 ± 0.7332 |
| With T | -0.0602 ± 0.0289 | 2.2348 ± 0.7332 |
| Seed | Δ NLL, raw | Δ NLL, with T | Δ accuracy (pp) |
|---|---|---|---|
| 42 | -0.449991 | -0.083065 | 2.9323 |
| 43 | -0.440005 | -0.069907 | 2.3017 |
| 44 | -0.371968 | -0.027732 | 1.4705 |
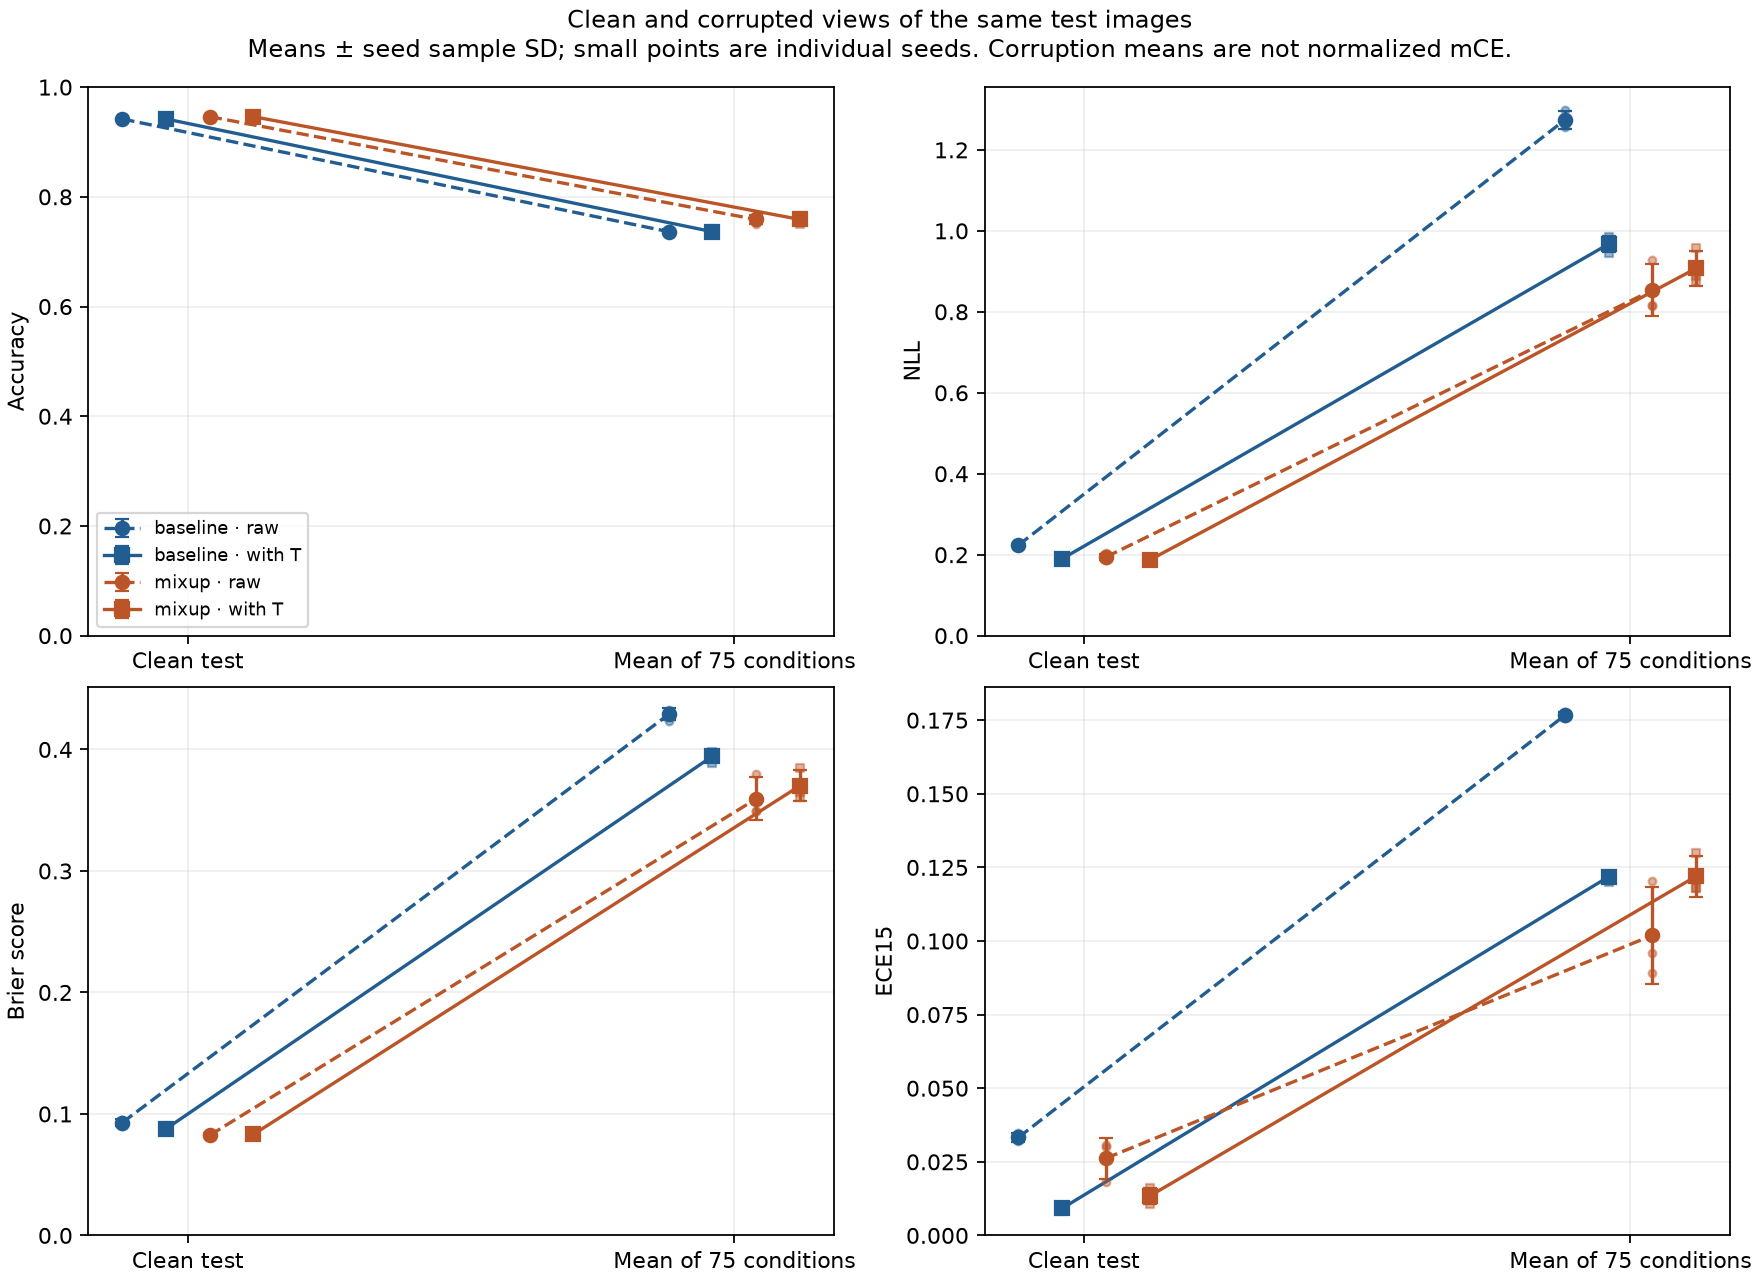
Mean clean accuracy rose from 94.19% to 94.62%; mean corruption accuracy rose from 73.64% to 75.88%. Raw corruption NLL fell from 1.274 to 0.853. The direction of the primary NLL contrast favored mixup in all three seeds, both before and after scaling.
Calibration did not transfer uniformly
Temperature scaling reduced clean-test NLL for both methods. Under corruption, baseline NLL improved from 1.274 to 0.967, while mixup NLL increased from 0.853 to 0.907. This opposite direction occurred in all three seeds. For mixup, mean corruption Brier score increased from 0.3593 to 0.3701 and ECE15 from 0.1019 to 0.1219.
Positive scalar temperature leaves argmax predictions and accuracy unchanged. The fitted temperatures were above 1 for baseline and below 1 for mixup. They soften baseline probabilities and sharpen mixup probabilities; the measured effects depend on the test condition and metric.
| Test condition | Method | Scaling | Accuracy (%) | NLL | Brier | ECE15 |
|---|---|---|---|---|---|---|
| Clean test | Baseline | Raw | 94.1933 ± 0.1858 | 0.2235 ± 0.0029 | 0.0930 ± 0.0026 | 0.0333 ± 0.0014 |
| Clean test | Mixup | Raw | 94.6167 ± 0.0896 | 0.1941 ± 0.0082 | 0.0825 ± 0.0017 | 0.0262 ± 0.0070 |
| Clean test | Baseline | With T | 94.1933 ± 0.1858 | 0.1899 ± 0.0039 | 0.0878 ± 0.0022 | 0.0092 ± 0.0008 |
| Clean test | Mixup | With T | 94.6167 ± 0.0896 | 0.1868 ± 0.0028 | 0.0832 ± 0.0016 | 0.0134 ± 0.0028 |
| 75-condition mean | Baseline | Raw | 73.6419 ± 0.4522 | 1.2739 ± 0.0223 | 0.4289 ± 0.0050 | 0.1766 ± 0.0011 |
| 75-condition mean | Mixup | Raw | 75.8767 ± 0.7905 | 0.8532 ± 0.0641 | 0.3593 ± 0.0176 | 0.1019 ± 0.0165 |
| 75-condition mean | Baseline | With T | 73.6419 ± 0.4522 | 0.9674 ± 0.0201 | 0.3945 ± 0.0052 | 0.1218 ± 0.0016 |
| 75-condition mean | Mixup | With T | 75.8767 ± 0.7905 | 0.9071 ± 0.0435 | 0.3701 ± 0.0127 | 0.1219 ± 0.0068 |
NLL is mean negative natural log probability of the true class. Brier is the mean sum of squared probability errors over all ten classes. ECE15 uses 15 equal-width confidence bins. Lower values are better for these three metrics; each measures a different aspect of the predictions.
Original analysis figures
What the results support
- Three seeds describe this experiment. Sample SD shows between-seed variability. It is not a confidence interval, and these runs do not establish statistical significance or equivalence.
- Corrupted images share their source cases. The 75 versions of an image are correlated. The summaries weight each condition equally within each run; they do not treat 750,000 views as independent test cases. This mean is not normalized mCE.
- Metric gains are not universal. After scaling, mean corruption ECE15 is 0.1218 for baseline and 0.1219 for mixup, despite mixup's lower NLL. ECE depends on the bin definition and is calculated per condition before averaging.
- Severe corruptions still cause substantial errors. Averaged over corruption types, severity-5 accuracy is 55.79% for baseline and 60.02% for mixup. These results concern CIFAR-10-C and this training configuration; they do not establish adversarial robustness, OOD detection, or general deployment performance.
- Test results are the final evaluation. Choosing a new temperature or changing training based on these observations would require a separately reported follow-up study.
Run evidence
| Method | Seed | Selected epoch | Temperature |
|---|---|---|---|
| Baseline | 42 | 97 | 1.468553 |
| Mixup | 42 | 99 | 0.817504 |
| Baseline | 43 | 100 | 1.507146 |
| Mixup | 43 | 99 | 0.862529 |
| Baseline | 44 | 97 | 1.488337 |
| Mixup | 44 | 94 | 0.945717 |
This page is derived from the completed study's comparison.json, comparison.csv, and original generated figures. The implementation preserves per-condition predictions, IDs, checkpoint and source hashes, calibration records, and evaluation identities. The public repository provides the code and frozen protocol. The full technical report preserves the measured tables and provenance; the results discussion explains the findings and limitations.